Plot Self-Spectrum for a SeaSondeRCS Object
Source:R/SeaSondeRCS.R
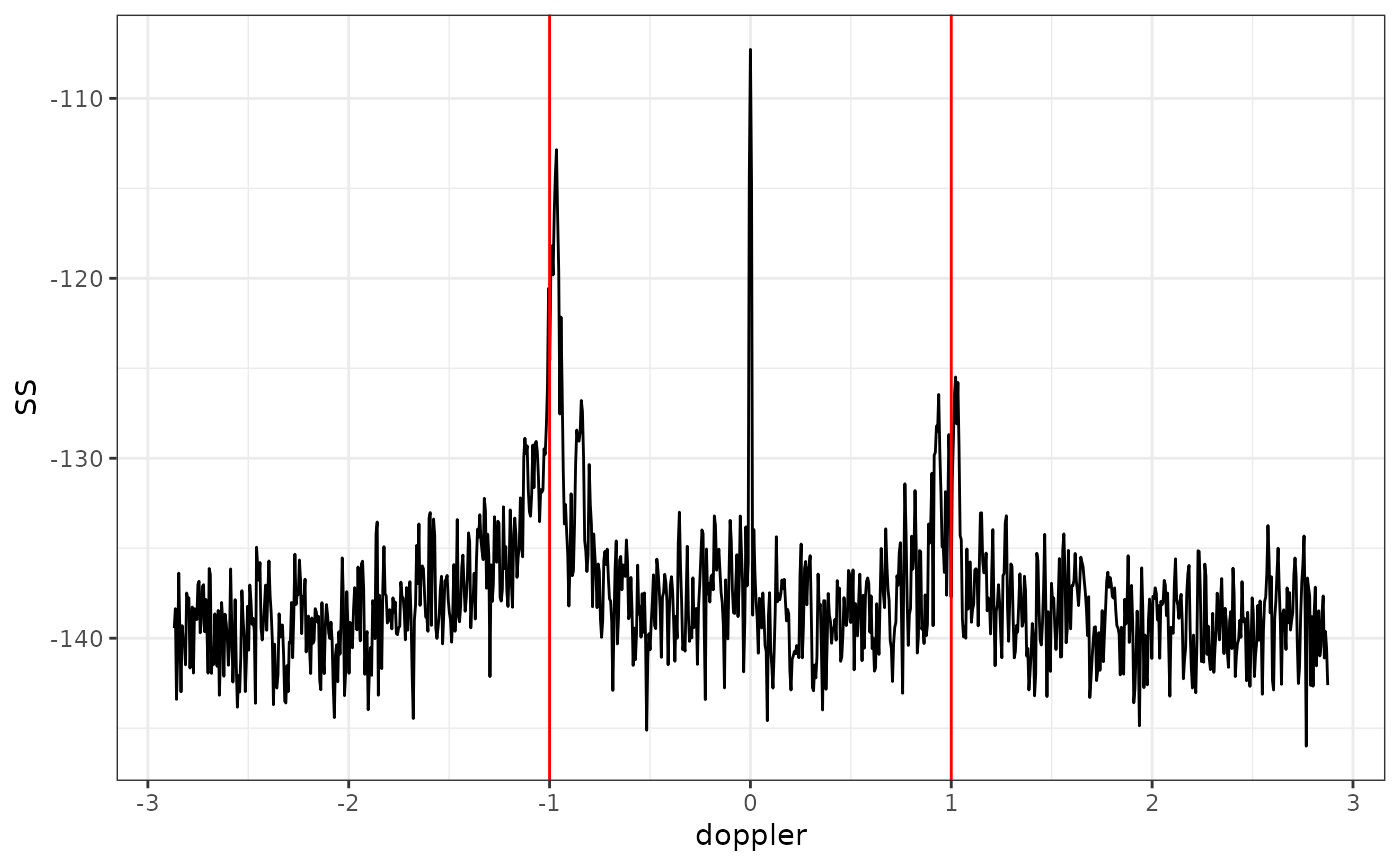
seasonder_SeaSondeRCS_plotSelfSpectrum.RdThis function generates a plot of the self-spectrum (in dB) for a specified antenna and range cell from a SeaSondeRCS object. The Doppler frequencies are converted to the desired units before plotting. Optionally, it overlays additional elements such as smoothed self-spectrum lines, first-order region (FOR) vertical lines, and noise level lines.
Usage
seasonder_SeaSondeRCS_plotSelfSpectrum(
  seasonder_cs_object,
  antenna,
  range_cell,
  doppler_units = "normalized doppler frequency",
  plot_FORs = FALSE
)
Arguments
- seasonder_cs_object
A SeaSondeRCS object containing spectral and metadata.
- antenna
An integer or vector specifying the antenna(s) to extract the self-spectrum from.
- range_cell
An integer indicating the range cell to extract the spectrum.
- doppler_units
A character string specifying the desired Doppler units for the plot. Commonly "normalized doppler frequency" or "doppler frequency" (Hz). Default is "normalized doppler frequency".
- plot_FORs
Logical. If
TRUE, the function overlays elements related to the first order region (FOR) such as vertical lines at the FOR boundaries and the smoothed self-spectrum. Default isFALSE.
Details
The function performs the following steps:
Retrieves the self-spectrum data for the given antenna and range cell using
seasonder_getSeaSondeRCS_SelfSpectra.Converts the Doppler bin frequencies to the specified units using
seasonder_SwapDopplerUnits.Converts the self-spectrum to dB using
seasonder_SelfSpectra2dBand combines it with the Doppler values.Retrieves the Bragg Doppler angular frequency for plotting a reference vertical line.
If
plot_FORsisTRUE, overlays:An orange line for the smoothed self-spectrum.
Blue vertical lines for FOR boundaries.
Red lines indicating the noise level across the Doppler spectrum.
Finally, returns the ggplot object.
Examples
# Prepare a SeaSondeRCS object for plotting self-spectrum
apm_file <- system.file("css_data/MeasPattern.txt", package = "SeaSondeR")
apm_obj <- seasonder_readSeaSondeRAPMFile(apm_file)
#> seasonder_createSeaSondeRAPM:  APM object created successfully.
cs_file <- system.file("css_data/CSS_TORA_24_04_04_0700.cs", package = "SeaSondeR")
cs_obj <- seasonder_createSeaSondeRCS(cs_file, seasonder_apm_object = apm_obj)
#> new_SeaSondeRCS:  SeaSondeRCS object created successfully.
# Plot self-spectrum for antenna 1, range cell 5
p <- seasonder_SeaSondeRCS_plotSelfSpectrum(cs_obj, antenna = 1, range_cell = 5)
print(p)